Going Faster Guided by Data
I’ve been doing track days for a while now. The appeal is immediately obvious: closed circuit, no speed limits, no traffic, just you and the bike. But once the initial thrill settles, a different kind of obsession takes over—going faster.
The thing is, motorcycles give you very little feedback about why you’re slow. You can feel it. But feeling it and knowing it are different things. Memory is unreliable, especially when your brain is busy calculating corner entry lines at 150km/h.
And I had a GoPro. So I had footage—hundreds of gigabytes of it, sitting on drives going nowhere. Clipped for a few Youtube videos, otherwise completely untouched. Track days I couldn’t learn from because the data was locked inside a camera.
So I built the tool I actually wanted.
First Attempt: Electron
My first instinct was Electron. You want a desktop app, you already know JavaScript, Electron gets you there fast. It worked—the core pipeline was proven on Electron first, and that mattered.
The problems were predictable in hindsight.
Electron ships its own copy of Chromium—roughly 100–200 MB before a single line of application code. For an app that also bundles FFmpeg, FFprobe, and a full Node.js runtime for processing telemetry, the installed footprint hit around 700 MB. Memory usage was the next issue. And then there were all the small things: a title bar that never looked quite right on macOS, scrollbars that felt slightly off, the general sense that it wasn’t a native app.
Yes, I’m aware of the irony. I wrote a whole post about building Fokus because I was tired of RAM-hungry Electron apps, and then I went and built one. It was the right tool to prove the concept. Ship now, fix later.
Switching to Tauri
Tauri uses the platform’s native WebView instead of bundling Chromium. It’s already installed, already maintained by the OS, and costs nothing in bundle size. Application logic that would’ve lived in Electron’s main process moves to Rust.
The installed size dropped from ~700 MB to ~300 MB. Still not small—the bundled Node.js runtime and FFmpeg binaries account for most of it—but half of what it was. And Tauri 2 requires you to explicitly allow every filesystem path and plugin permission, which forced me to actually think about what the app needs access to rather than just letting it do whatever.
The Data Pipeline
When you import a session, a lot happens before you see anything on screen.
GoPro cameras split recordings into ~4 GB chapters, so the importer first figures out which files belong together by matching filename prefixes—GX010142.MP4, GX020142.MP4, and so on—and concatenates them with FFmpeg. Then it extracts the telemetry. GoPro cameras embed sensor data in a binary format called GPMF in a dedicated MP4 track, recording GPS at 18 Hz (10 Hz in older devices) alongside accelerometer and gyroscope streams. A Node.js processor (bundled inside the Tauri app as a subprocess) parses all of this into structured data, runs lap detection, and outputs GeoJSON.
Running the processor as a Node.js subprocess rather than in the WebView was a pragmatic call—the GPMF parsing libraries live in the Node ecosystem, and keeping that layer separate means no bundler headaches. The Rust layer passes file paths in, waits, reads the output. Each part does what it’s good at.
Making the GPS Data Useful
Raw GPS at 18 Hz is noisy. Positional jitter is worst at low speeds, and you occasionally get hardware artefacts that need filtering. Coordinates are parsed to six decimal places—around 10 cm of precision at the equator, which is plenty for track-scale work.
Heading between consecutive samples is computed using the standard bearing formula. Below 2 m/s the GPS noise makes heading meaningless, so the previous value just carries forward.
The most involved calculation is lateral acceleration—the sideways force that maps to cornering load and, on a motorcycle, allows you to calculate a physic-derived estimate of lean angle. It’s derived from angular velocity multiplied by forward speed, but the raw derivative of heading is too noisy to use directly. The angular velocity stream goes through a Kalman filter first: a predict-and-update loop that balances how much you trust the model versus how much you trust each individual measurement. The parameters are tuned to favour the smoother model estimate over any single noisy reading. What comes out the other side is actually useful.
Counting Laps
Lap detection uses geometric line intersection. Each sector boundary—the start/finish line, or intermediate splits—is defined by two GPS coordinates. A lap is detected when consecutive GPS samples cross these boundaries in the correct sequence. The intersection test checks whether two consecutive samples A→B straddle the sector line using cross products. Timestamps at the crossing are interpolated to sub-sample precision so sector times are accurate.
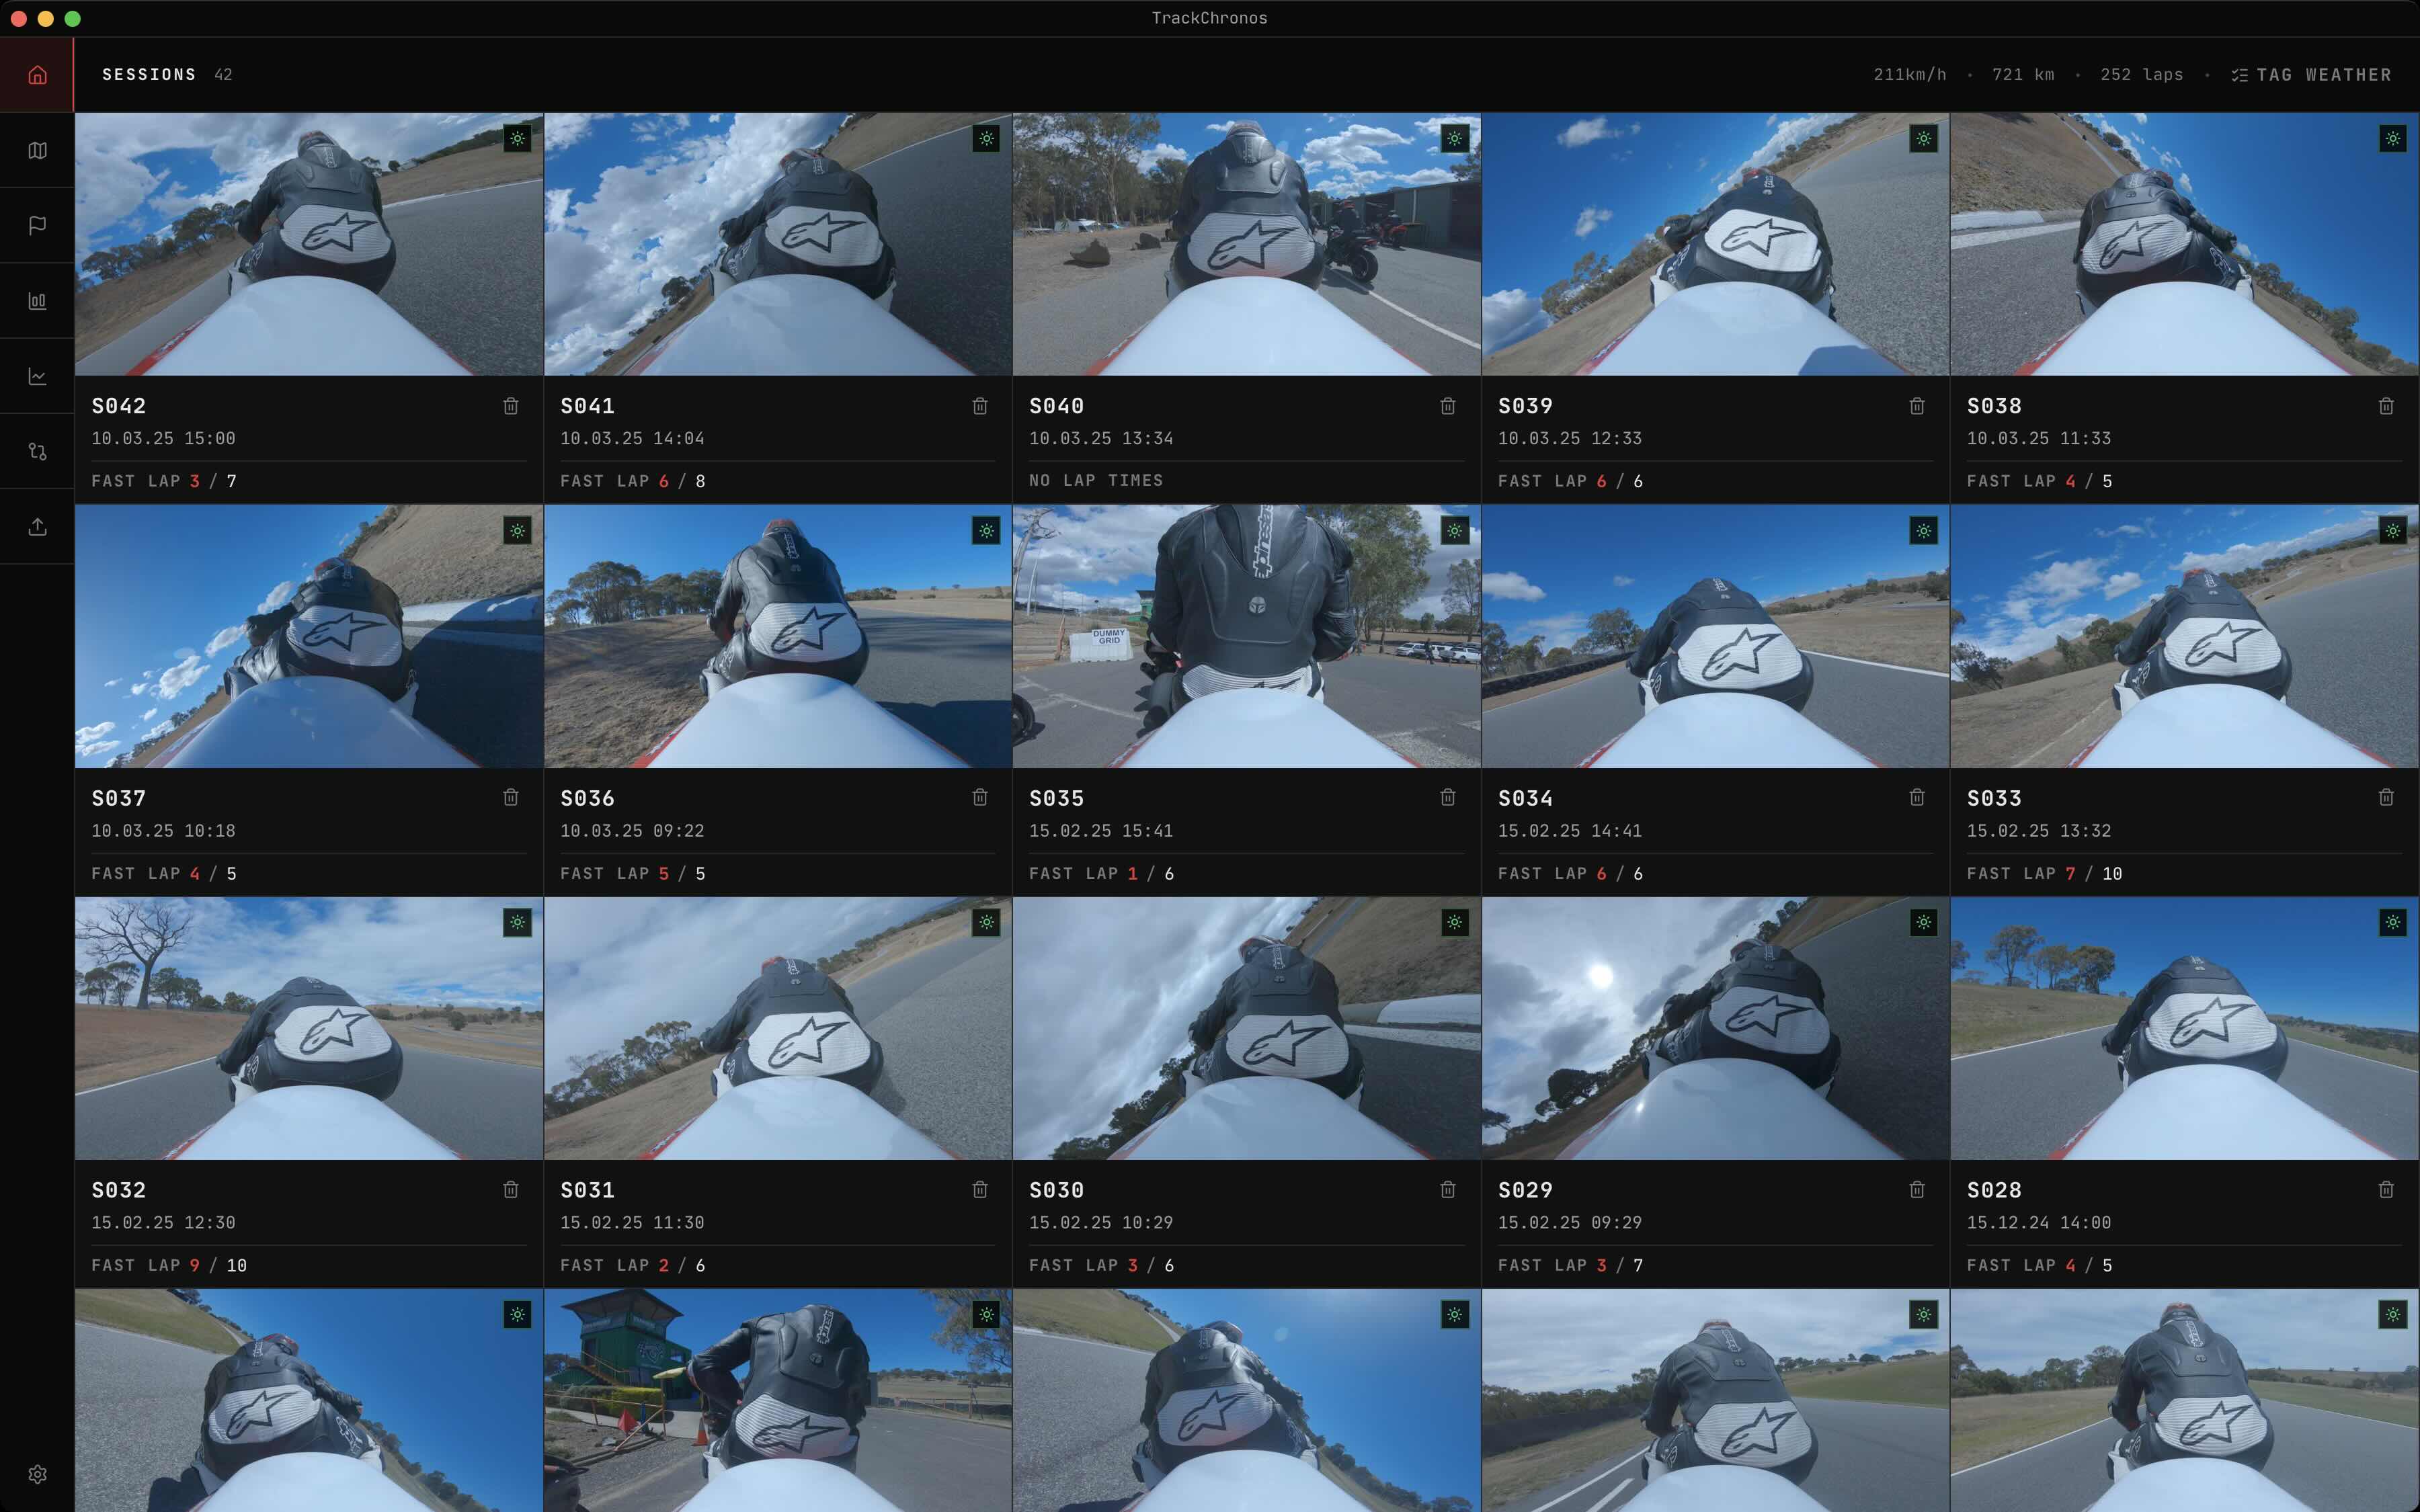
Partial laps at the start and end of a session are stored separately from timed laps, which matters if you’re comparing your clean flying laps across different track days.
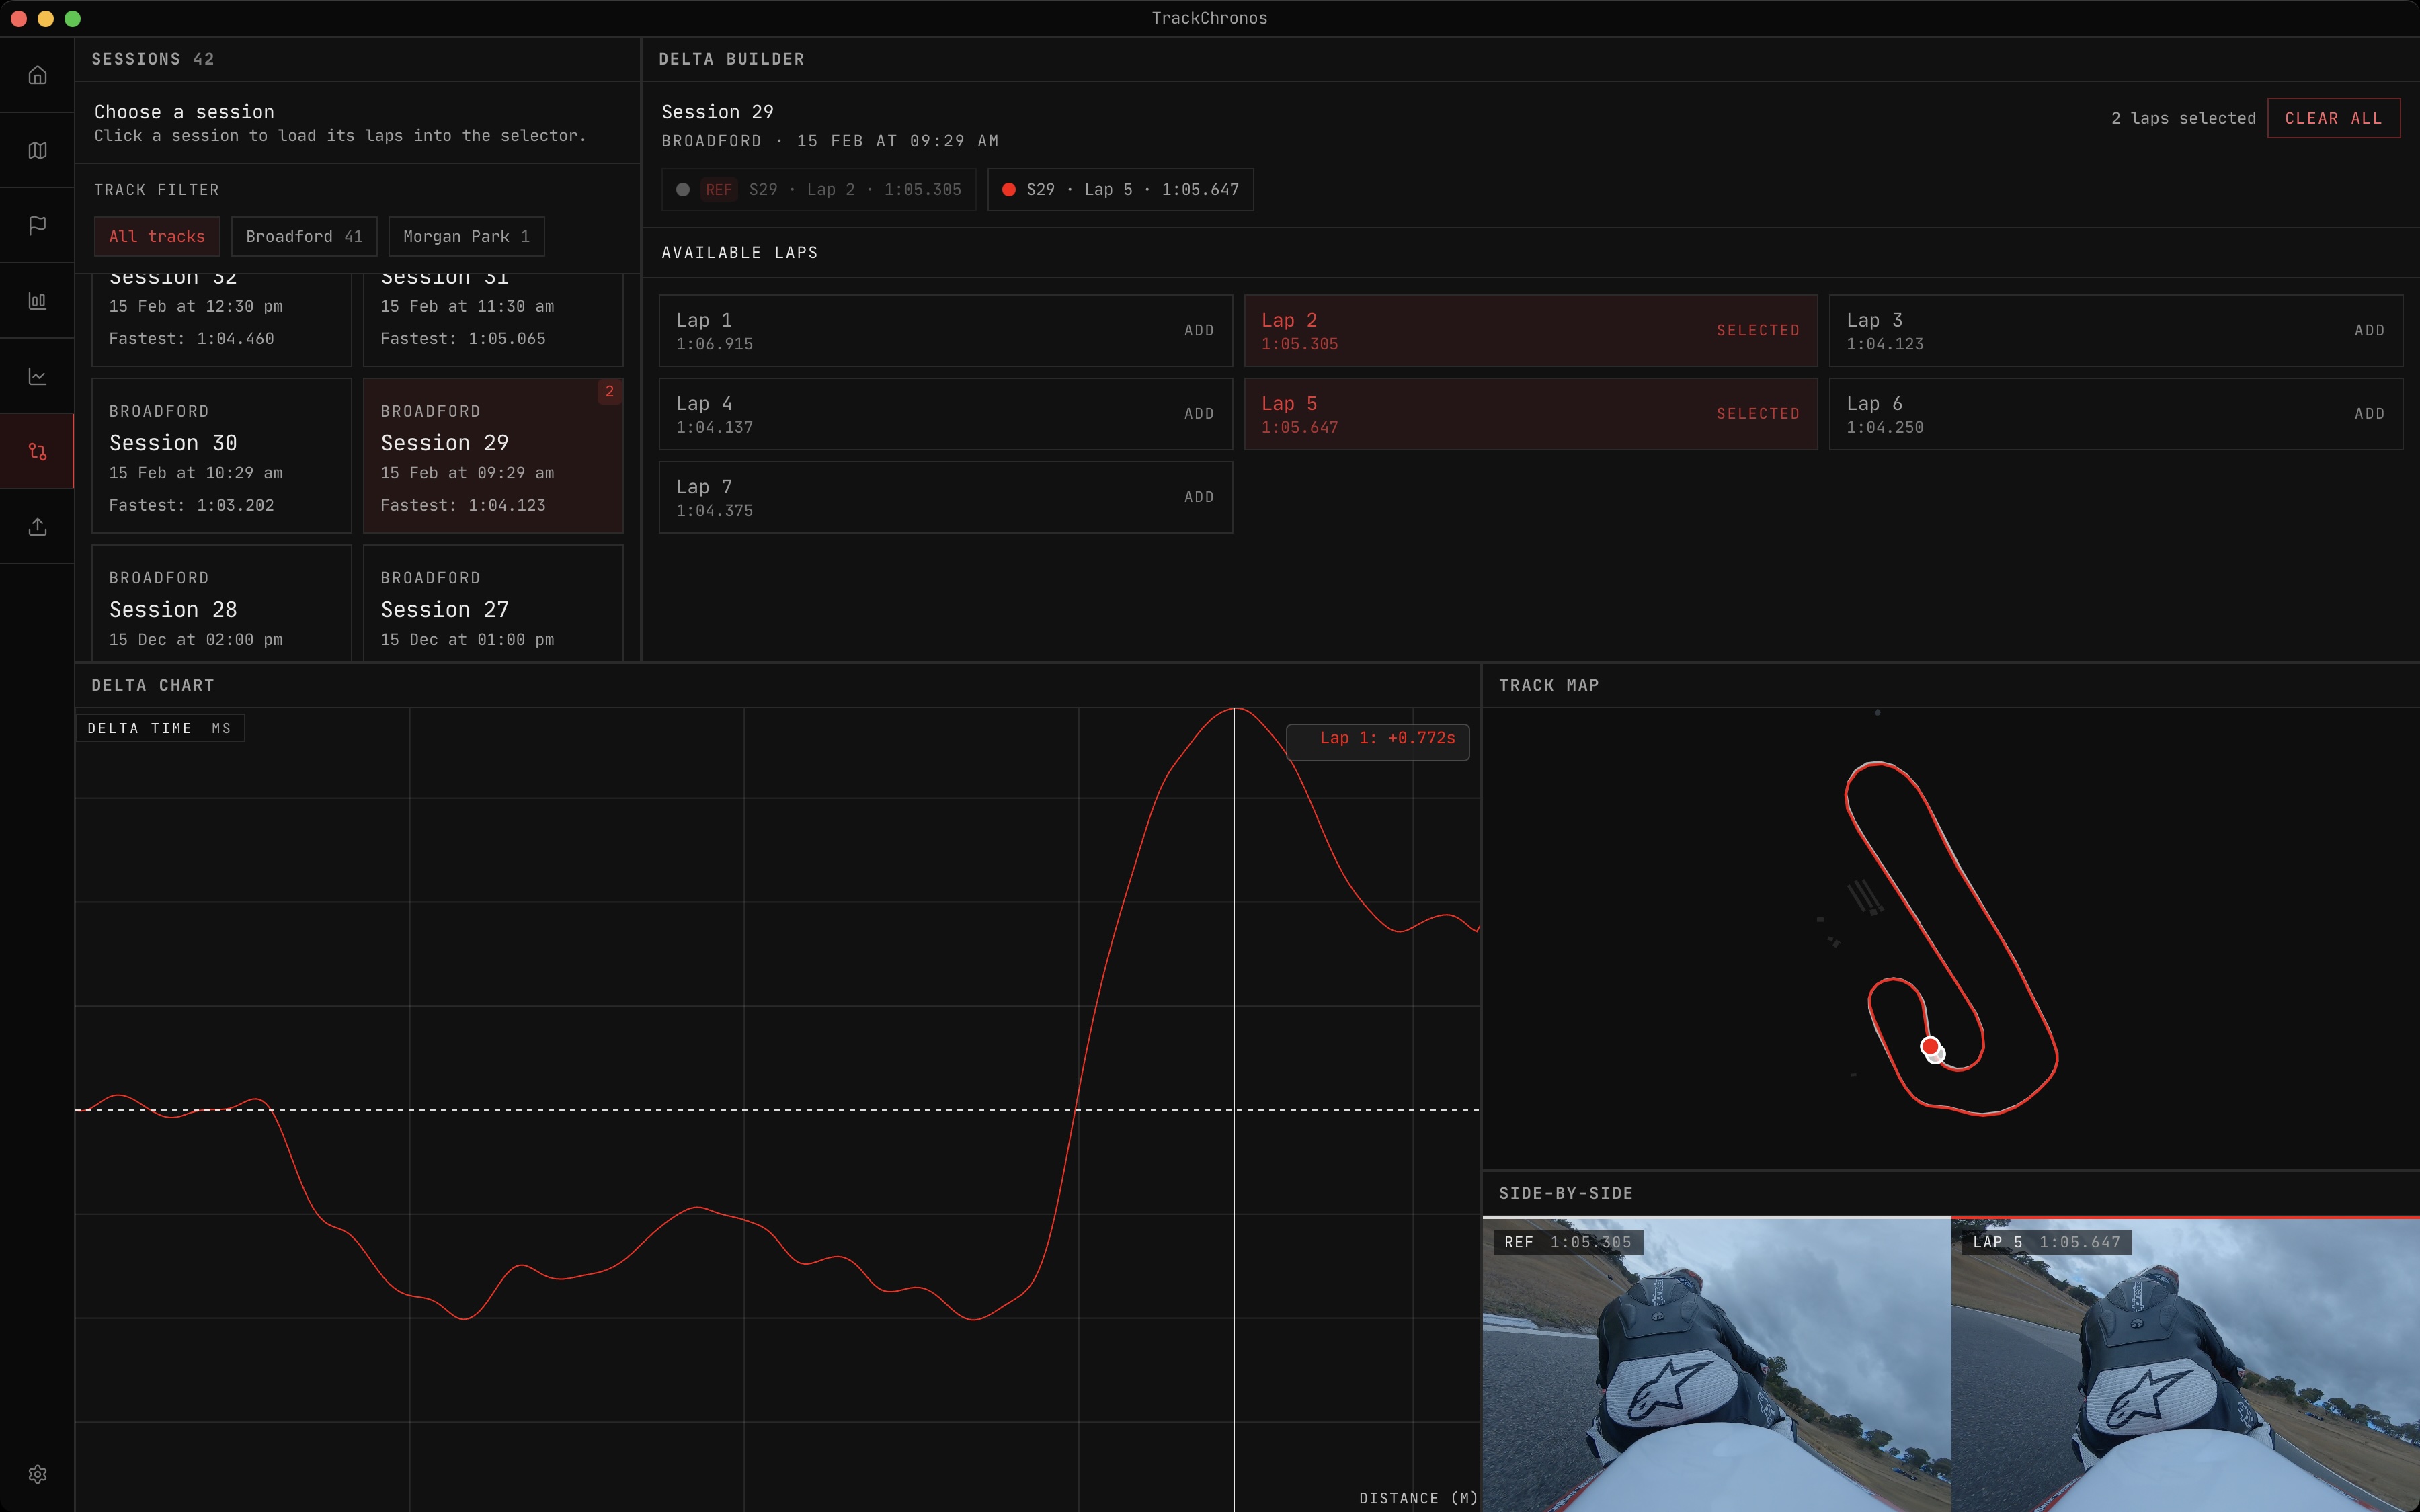
Visualisation
GPS traces are rendered with MapLibre GL—each session’s GeoJSON loaded as a source and drawn as a line layer. You can view multiple sessions at once, which is useful for comparing lines through a corner across different track days.
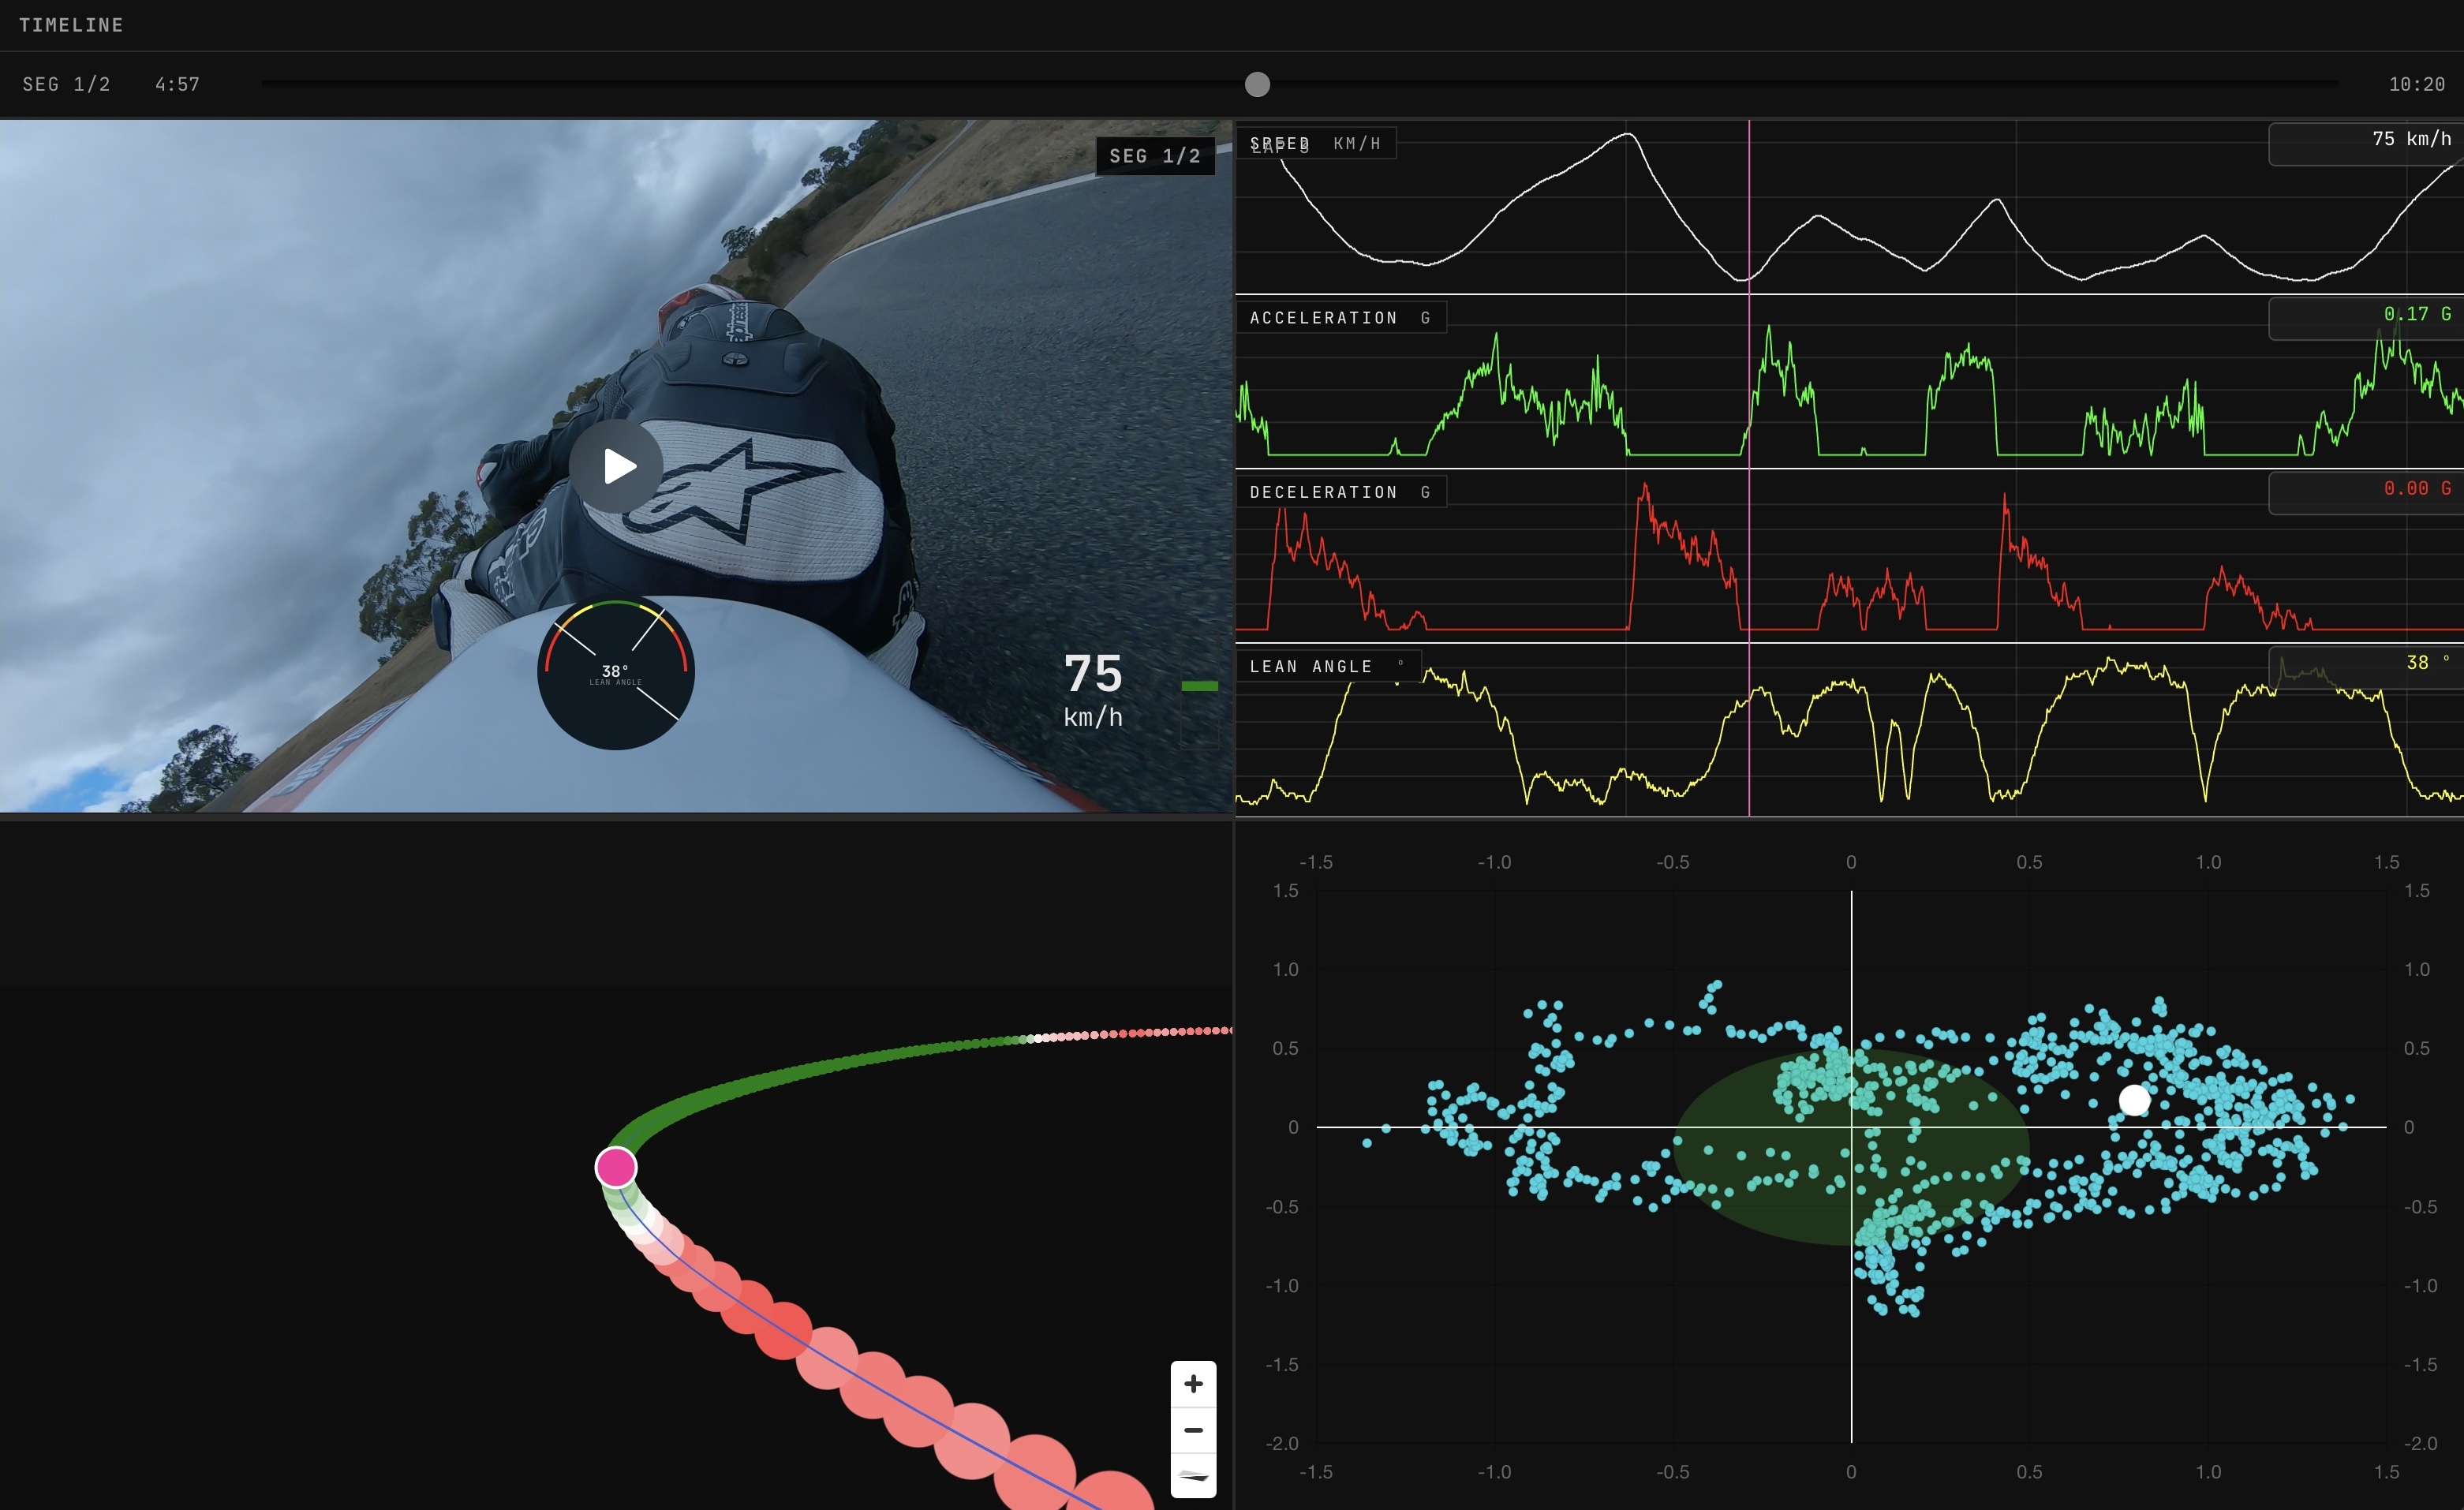
The multi-lap telemetry charts are built with D3 on a WebGL canvas. A five-minute segment of data at 10 Hz is around 5,400 data points—compare ten laps and you’re at 54,000. SVG at that scale is too slow to interact with, so WebGL it is.
The lean angle and G-force gauges are custom SVG components. They update as fast as the underlying data changes, which is exactly how it should feel.
Supporting More Than GoPro
GoPro is the most common source but not the only one. SpeedAngle make a dedicated motorcycle data logger which includes all the necessary data points to work with TrackChronos—GPS, lean angle via IMU, longitudinal acceleration. No video, so the processing path is simpler: no FFmpeg, no GPMF extraction. The parser just reads the SpeedAngle file and feeds the data through the same lap detection and GeoJSON pipeline.
The output is identical from the app’s perspective. That was the goal. The GeoJSON schema is the common language—any device that records GPS and inertial data needs only a parser that produces that schema, and nothing else in the system needs to change. I want this to work regardless of what logger you ride with.
What’s Next
The plan is straightforward: every data source a track day rider might use should eventually be importable. GoPro was the first step, and SpeedAngle was the second. The pipeline is ready for more.
The riders I built this for are the ones who care enough to buy a data logger, who watch their data between sessions, who want to know exactly where they lost those two tenths in sector two. That’s me. I built it for myself first, and if it’s useful for anyone else who rides on track, that’s exactly what I was hoping for.
Try It Out
Head to the website to learn more: TrackChronos.
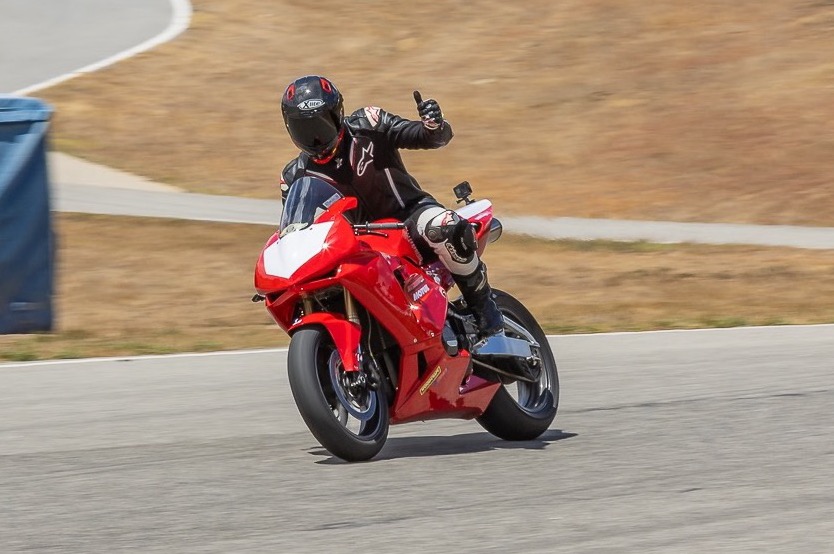
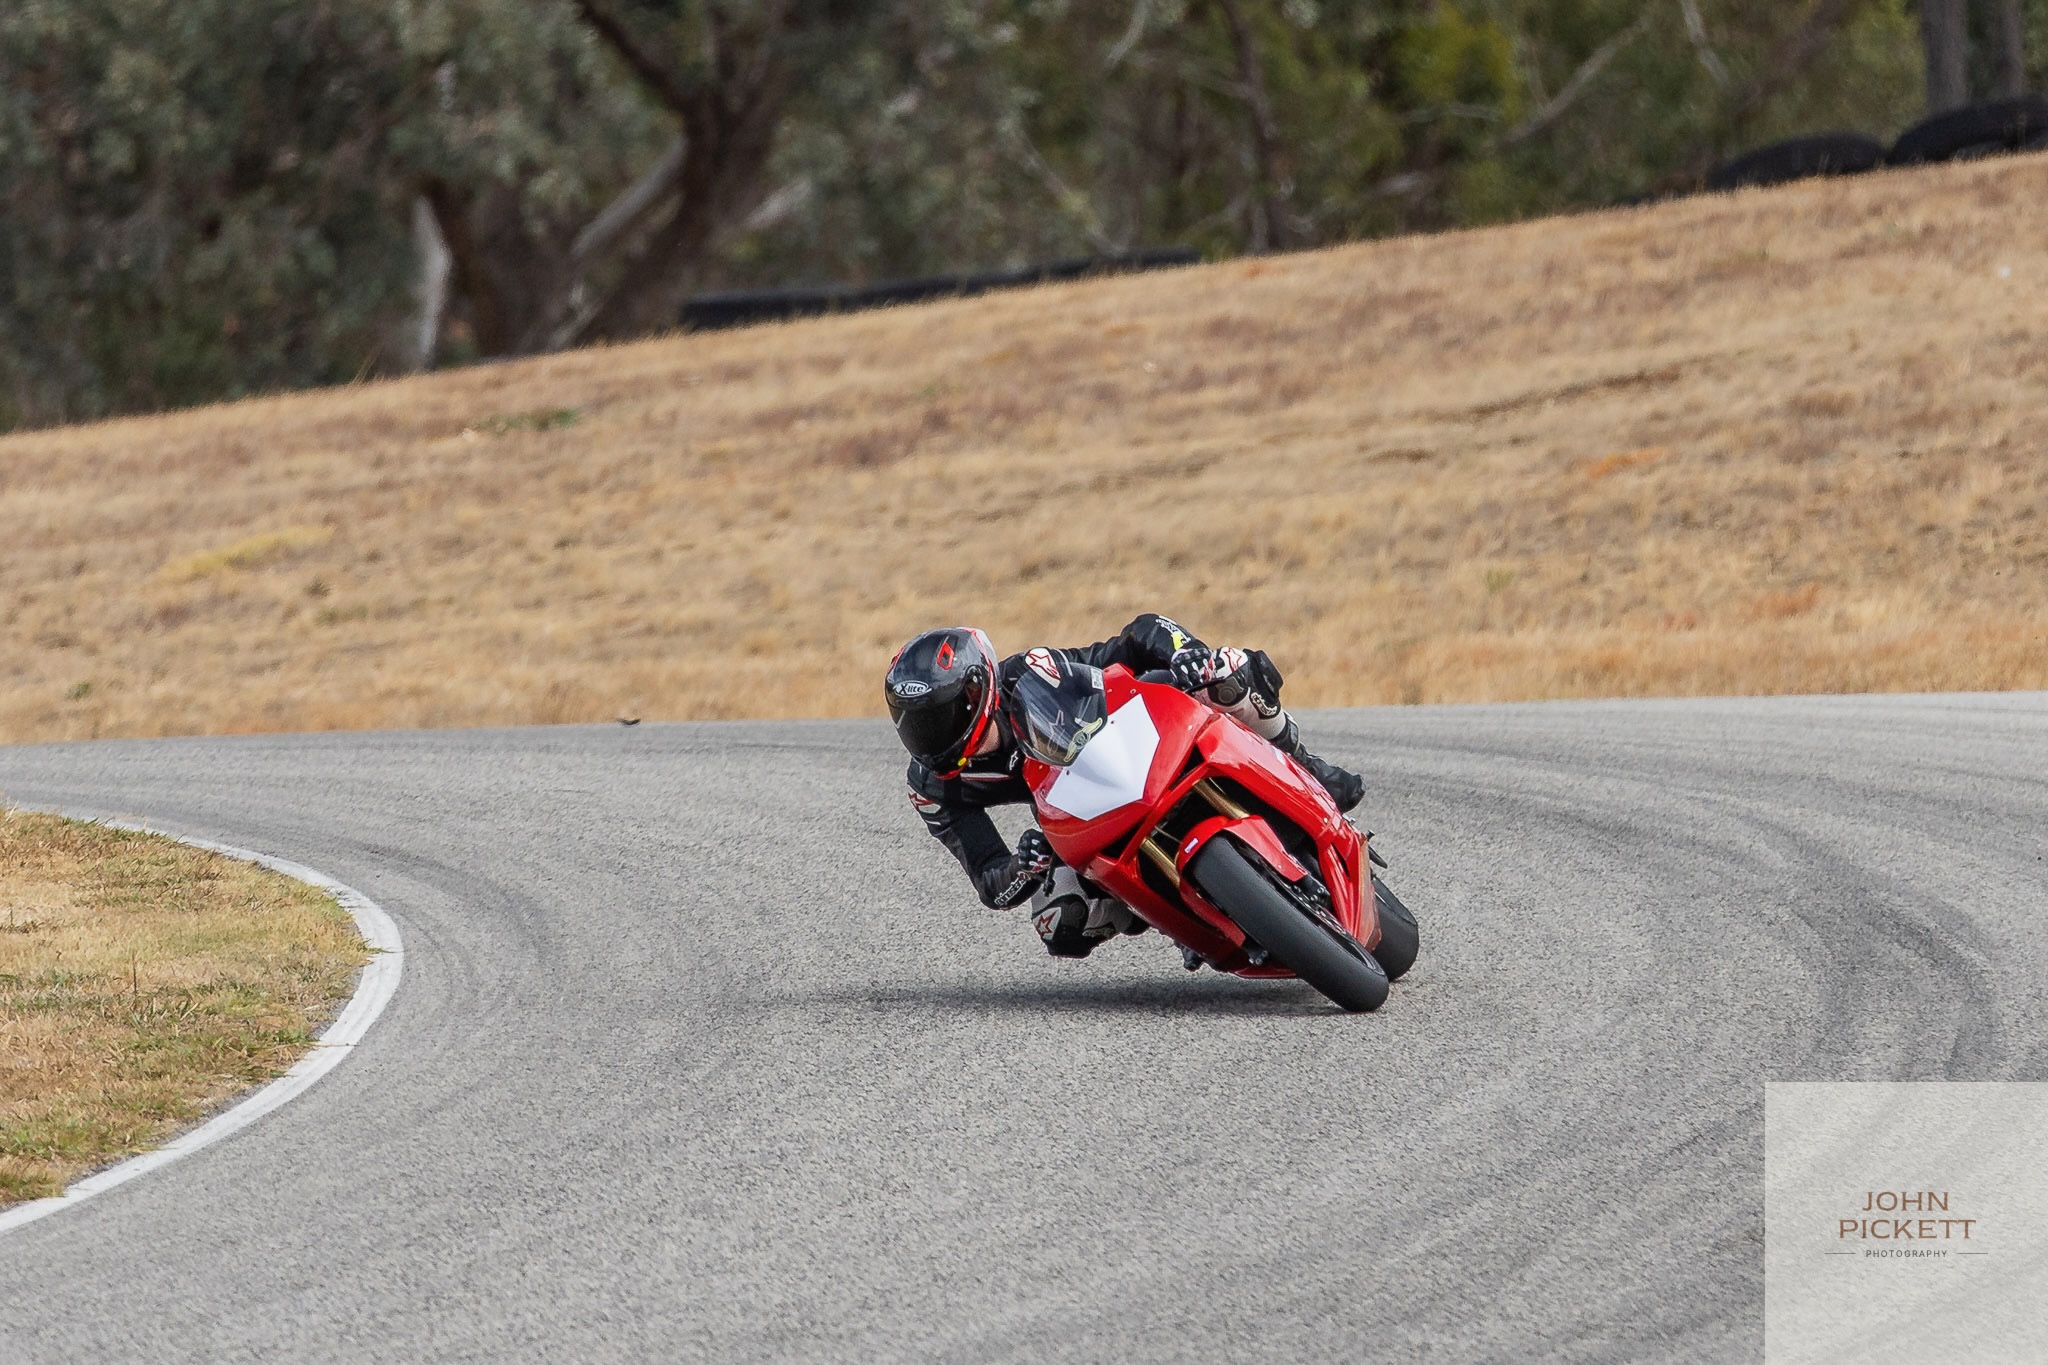
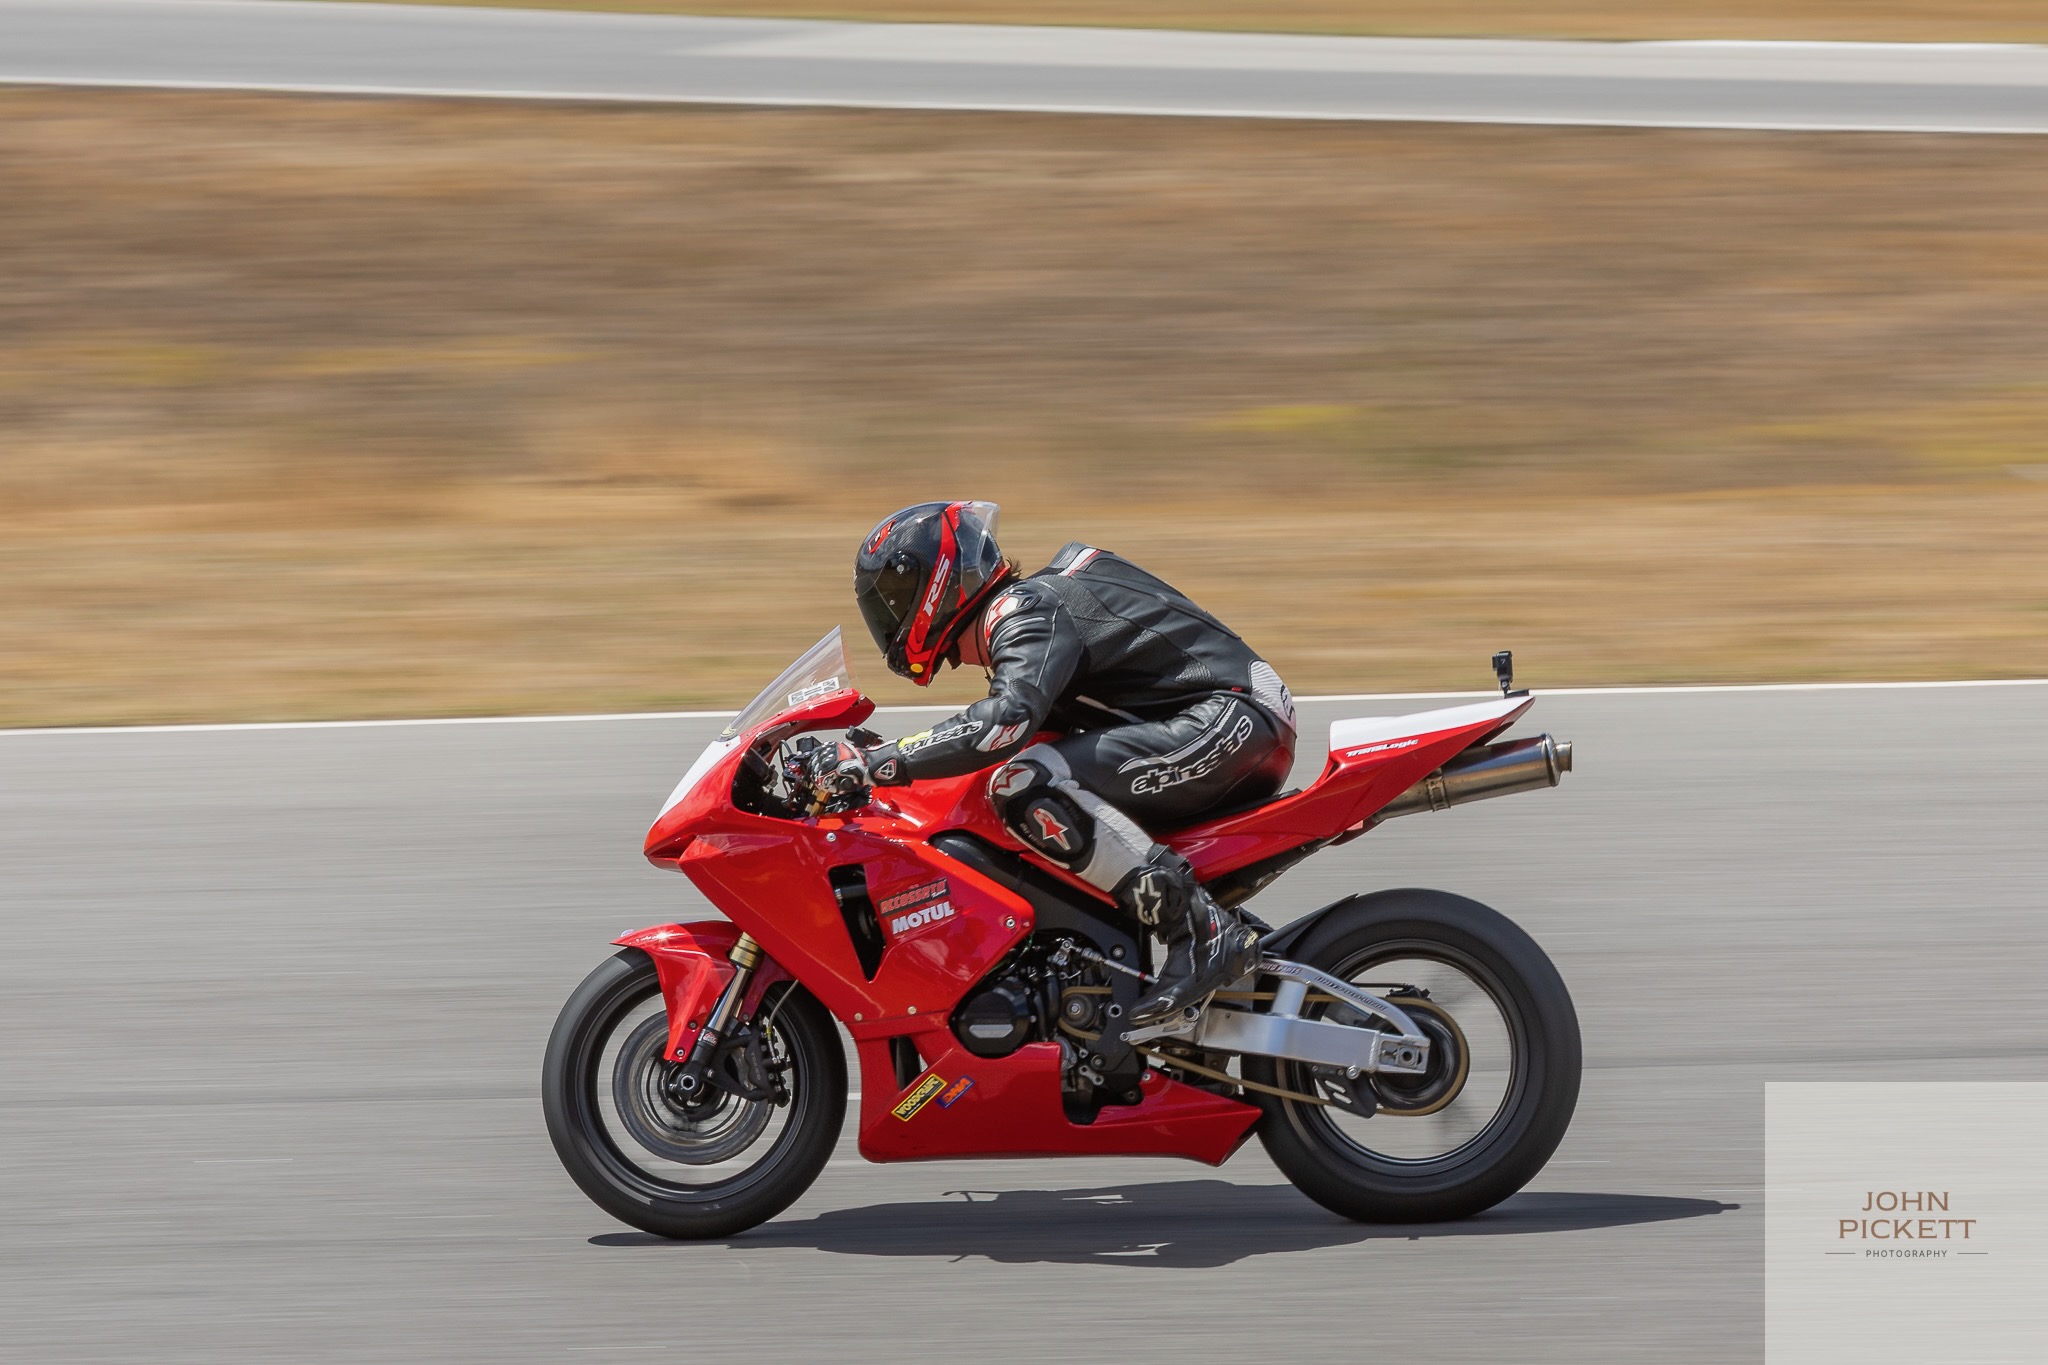
Photo credits: John Pickett Photography.